Chart reading has become hugely popular among Indian market participants, particularly those who follow bank stocks on mobile apps throughout the day. People who track the PNB share price often use support and resistance levels to time entries, while those watching the Yes Bank share frequently talk about volume spikes and breakouts. Technical analysis can be a helpful lens, but it works best when it is combined with a sound understanding of business quality. This article explains how to use charts sensibly, which patterns deserve attention, and why fundamentals should always sit beside the screen when you make decisions about financial sector holdings.
What Charts Can and Cannot Tell You
A price chart documents the activities of buyers and sellers. It captures zones of demand and oversupply, as well as reactions to news. This is valuable information, as it reflects the mood of the market and decision-making levels of many investors. It is less valuable as a guide to the future, and says nothing about reasons for movement in a bank’s earnings.
Think of a chart as a map of crowd behaviour rather than a prophecy. A stock could easily peak above a resistance and fall back if a negative regulatory announcement coincides. Treat every pattern as a possibility, not a guarantee, and know in advance how much you’ll lose if it does not pan out.
Support, Resistance and Trend
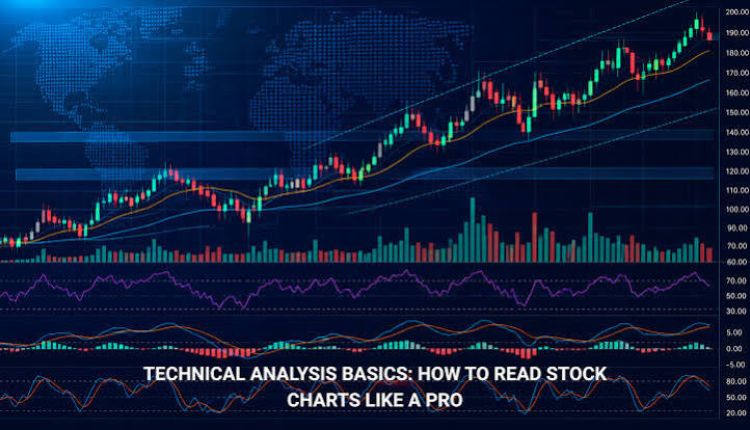
Support is a zone wherein buying has repeatedly manifested itself, and resistance, a zone wherein selling has. If a stock remains above support and gradually forms higher lows, the trend is deemed positive. If it repeatedly fails at resistance, the trend could be running out of steam. Charts drawn on a weekly and monthly basis are more reliable than shorter time frames, as they iron out day-to-day volatility.
Moving averages smooth out price trends and enable one to determine direction. Many Indian investors track the fifty-day and two-hundred-day moving averages, and view a sustained move above the longer-term average as positive. Volume provides further confirmation. A breakout accompanied by heavy trading is more reliable than one that witnesses light volume. Beware of stocks with large retail participation, as spikes in volume could reflect enthusiasm rather than reasoned buying.
Indicators in Moderation
Indicators such as the relative strength index and moving average convergence divergence are derived from price and volume. They can be used to identify stretched conditions wherein a stock has raced up or fallen too far, too fast. Used alone, though, they can generate conflicting signals, particularly in a strongly trending market wherein a stock can remain overbought for long periods of time.
It is best to pick two or three indicators, understand them and stop there. Too many tools generate conflicting signals that lead to hesitation or unwarranted bravado. Test your methodology on historical data, and see if it works across differing market phases, including steep declines.
Linking Charts to Business Reality
Before acting on any technical cue, it is important to link it to the fundamentals. Is asset quality improving? Is capital adequacy rising? Are deposits and margins growing? A bullish chart, coupled with improving fundamentals, is more reliable than one not linked to anything. Likewise, a weak chart in a company with improving numbers could be a good value, provided you’ve done the due diligence to ascertain that it is indeed a value.
Events can trump any chart pattern. Policy rate decisions, supervisory interventions, rating action, large block trades and quarterly results announcements can all impact a stock’s fortunes. Monitor the event calendar closely, and don’t open a big position just before such events unless you’re prepared to take a hit in case something goes wrong.
Managing Risk Above All
Whatever methodology you adopt, it is crucial to implement risk controls. Decide on your position size first, implement a stop-loss that makes sense given your technical view and avoid averaging down on a loser without good reason. Limit the amount of savings that you expose to short-term trading, and keep long-term investments in a separate account so that you’re not tempted to mix the two.